Fall COVID-19 Economic Impact Survey Analysis
Executive Summary
To gauge confidence amongst CHBA BC members and to hear how the pandemic has affected their business, in April 2020, we conducted our first (Spring) Economic Impact Survey. The survey asked key questions that impact the residential construction industry, including permit wait times, government support measures, and changes in employment levels.
CHBA BC conducted its second (Fall) COVID-19 Economic Impact survey of its members. Distributed through our eight local associations, and covering the period from September 24 to October 9, 2020, the purpose of this survey is to receive insight on how the pandemic has economically affected business operations of our members, now and in the near future. A total of 198 valid responses were received.
Our survey findings identify the length of permitting time and how supply chains have been affected, causing increased construction costs. This survey reveals that layoffs of staff decreased but permitting times have significantly increased.
There is a noticeable change in business confidence, as 30% of respondents expect an increase in business (up from 20% in the spring survey). This survey is a step toward better understanding confidence — where it exists and lacking across British Columbia regions, and some of the obstacles’ builders face.
We hope you find the data in the survey useful and as always, welcome your feedback,
Neil Moody
CEO
Key Findings
View an infographic of our key findings here.
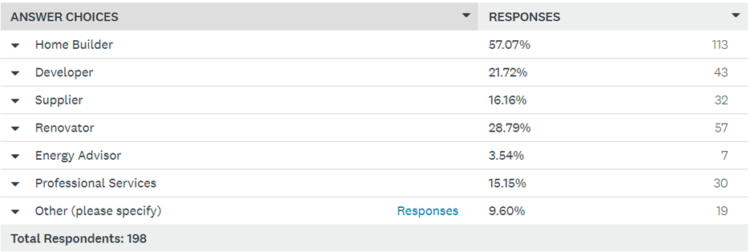
- Most respondents considered themselves homebuilders (57%) followed by renovator (29%), developer (22%) supplier (16%) and professional service (15%).
- In comparing the Spring and Fall survey results, layoffs of between 1-4 staff members went down from 43 per cent to 30 per cent, while no layoffs at all increased from 35 per cent to 56 per cent, respectively.
- Very little change was noted between the Spring and Fall survey responses with what federal government resources are being used by members, with CEBA (Canadian Emergency Business Account) at 58%, CEWS (Canadian Emergency Wage Subsidy) at 32% and the Temporary 10% Wage Subsidy, at 19%.
- Approximately 70% of respondents noted an increase in the length of time it takes for their permits to be approved since June 2020 – up from 50% in the Spring survey.
- Supply chain issues saw a marked increase between the Spring and Fall surveys, with an increase from 45 per cent to 62 per cent, respectively.
Analysis
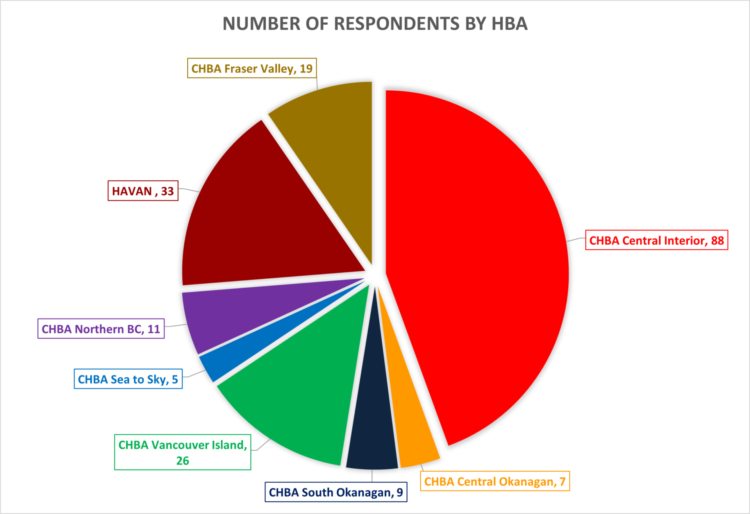
In comparing the business subsets from our Spring survey to our Fall survey, we have found consistency in the sampling distribution of responses by HBA/local, approximately +/- 3% variation. This allows us to be able to form a more accurate timeline of insights from the surveys when comparing the two.
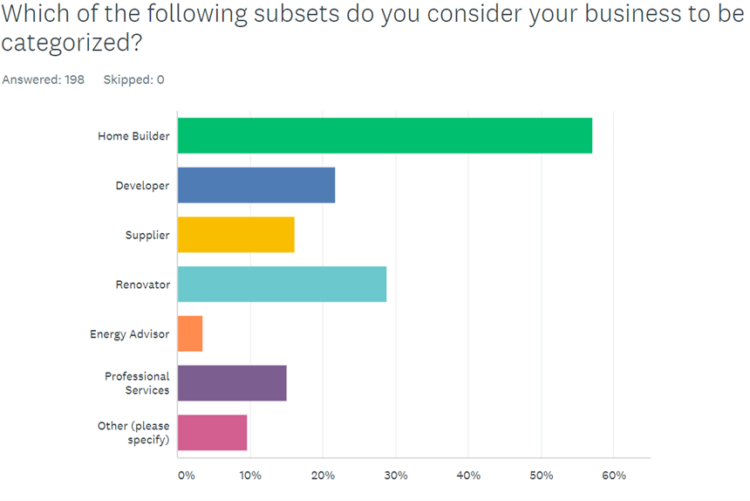
Please note that respondents were able to identify as more than one category subtype; therefore, percentages do not total to 100%.
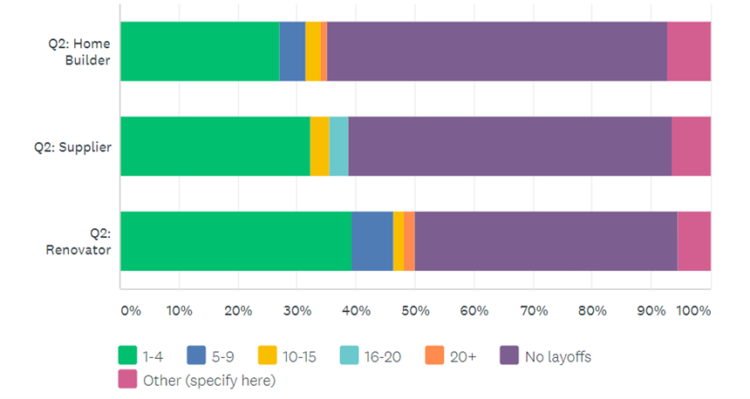
The Spring survey suggested both suppliers and renovators were hit harder with employee layoffs than home builder-members. Our Fall survey shows that this remains the case. From our two survey sets we advocated to the government (pre-election) and to all major parties (during the election) the need for policies that will see to home construction material PST reductions and renovation tax credits to help boost the businesses of renovators and suppliers hard hit by COVID-19.
One of the most significant takeaways from this survey is the changes in layoffs seen by respondents between the two data sets (Spring and Fall surveys). Layoffs of between 1-4 staff members went down from 43% to 30%, while no layoffs at all increased from 35% to 56%, between the two survey time periods.
Question Six (6) asked “Has your business experienced any lumber pricing/supply issues since June 2020?” Of the 171 respondents that answered this question, 75% responded with yes, which aligns with internal anecdotal experiences found at the Government Relations Committee.
Question Seven (7) asked “If yes to the above question (#6), what is the approximate additional cost per home?” Anecdotally, answers were spread from $8-$10K per home (on the low end) and $25-$30K per home (on the high end). When expressed as a percentage (which some respondents did over specific dollar value) the average increase that was noted was approximately 20%.
Question Eight (8) responses saw another significant change noticed between the Spring and Fall surveys where supply chain issues were noted, seeing an increase from 45% to 62%. The qualitative answers on this question reflect a number of different points: A) lumber was clearly noted as an issue in the Fall survey while relatively absent from the May one; 2) respondents were able to have a greater understanding of what products were disrupted due to COVID-19 in the Fall than in the Spring and 3) products that were noted as being disrupted in the Spring did not mark a noticed improvement come the Fall.
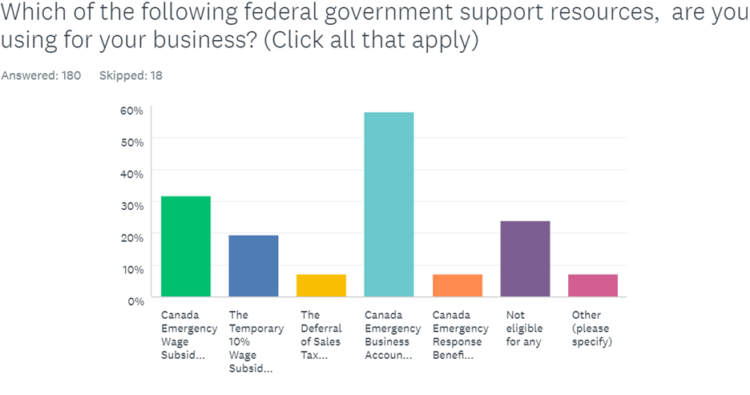
The above question was one of the few that saw practically no change at all in answers between the Spring and Fall responses. As resources, such as CEWS, received initial complaints of difficulty in submission of application or ineligibility of business, it was expected to see a greater intake of this resource as kinks were ironed out and revisions made – yet, this was not reflected in any data trends.
The trends with CEBA held steady as well, along with respondents still finding that it was the simplest to be eligible, apply and receive funding for.
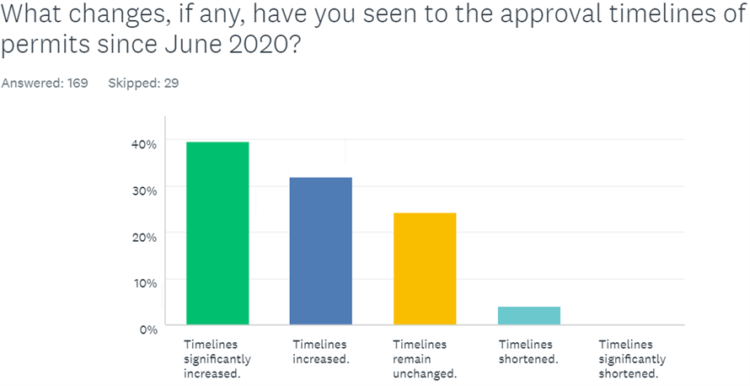
Approximately 70% of our respondents have noted an increase in the length of time it takes for their permits to be approved since June 2020, this is up from 50% of respondents who saw an increase in permit approval timing from the previous survey conducted in the Spring, reflecting a possible beginning trend of further delays occurring throughout the permit approval timelines.
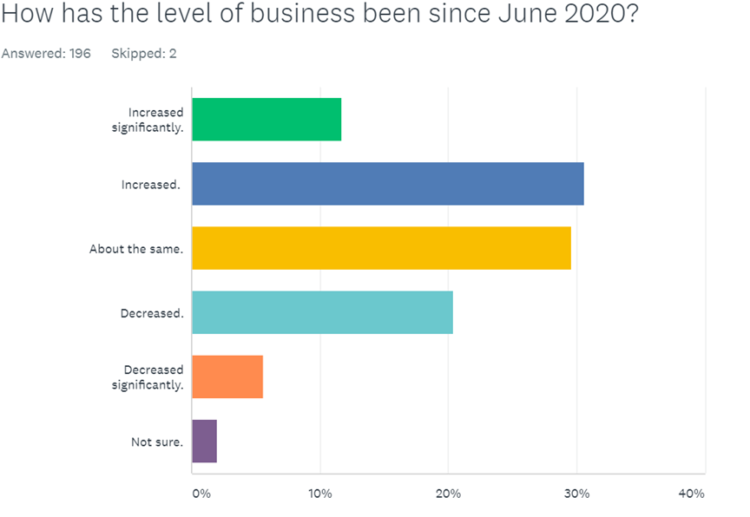
Business-level changes have seen some of the most dramatic shift in the Fall survey. 69 % of respondents to the Spring survey noted some decrease in business from the date of their response and March 15th, seeing a massive drop to 26% in the Fall survey (measuring business change from the date of response and June 2020). This shift is also reflected in the increase from the Spring survey, where only 7% of respondents saw an increase in business, shifting upwards to 42% in the Fall.
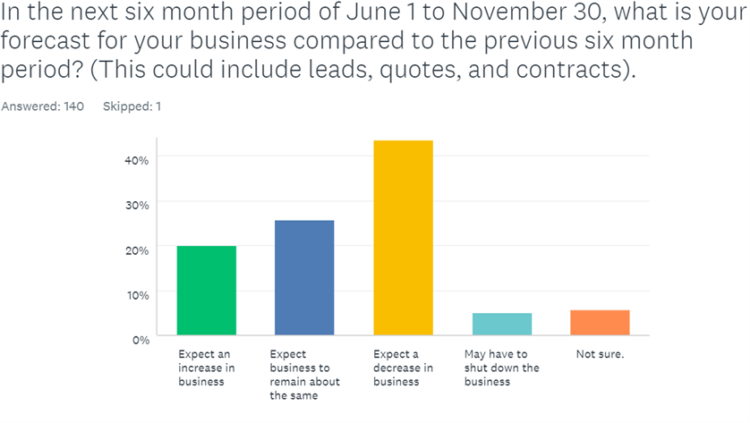
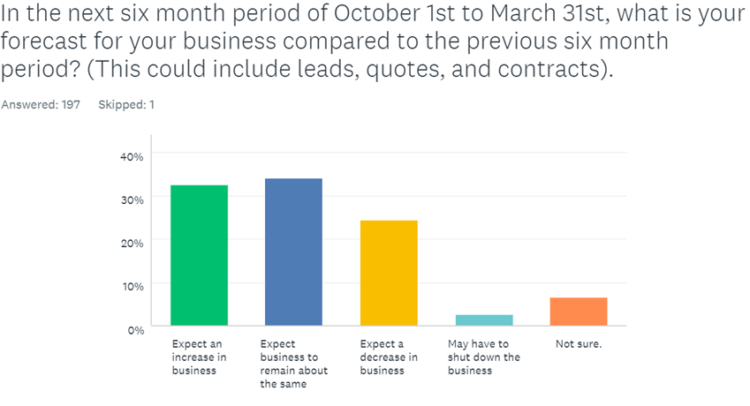
Future forecasting of business confidence has seen a marked increase from our Spring survey, with over 30% of respondents expecting an increase in business (up from 20%) and 24% expecting a decrease in business (down from 44%). The Fall survey saw most respondents expecting business to remain the same between Oct. 1st and March 31st (34%).
Next